Solutions · Understand
See your operation clearly
You can’t improve what you can’t see. We build the layer that turns data from your assets, devices and systems into a live, usable picture of the operation — from IoT platforms and operational digital twins to the dashboards teams read every day.
More sensors is not more insight
Most operations are not short of data. They are short of the few computed quantities that would actually tell them something — the ones no instrument reports, because they are relationships between readings rather than readings themselves.
Efficiency is the clearest example. A line can run inside every threshold on the panel and still be converting electricity into heat, because the quantity that would show it is a ratio nobody calculates in real time.
So the work is not adding instrumentation. It is building the model that turns what you already measure into the handful of numbers a supervisor can act on, and putting them where the decision is made rather than in a report read afterwards.
What it covers
From raw data to a clear picture
-
IoT & connected assets
Sensor-to-cloud platforms that bring physical assets online.
-
Operational digital twins
Live, connected-asset models of your operation — Toobler’s own digital-twin capability.
-
Dashboards & analytics
The operational view teams actually use to decide and act.
How an engagement runs
From first step to running
- 01
Connect
The asset, sensor, event and enterprise data a picture depends on.
- 02
Model
The assets and processes worth representing, as an operational twin where it fits.
- 03
Visualize
The dashboards and views teams actually read.
- 04
Act
Turn visibility into decisions and governed automation.
Proof
Where it has run before
 Case study IoT · Digital Twin · Real-time
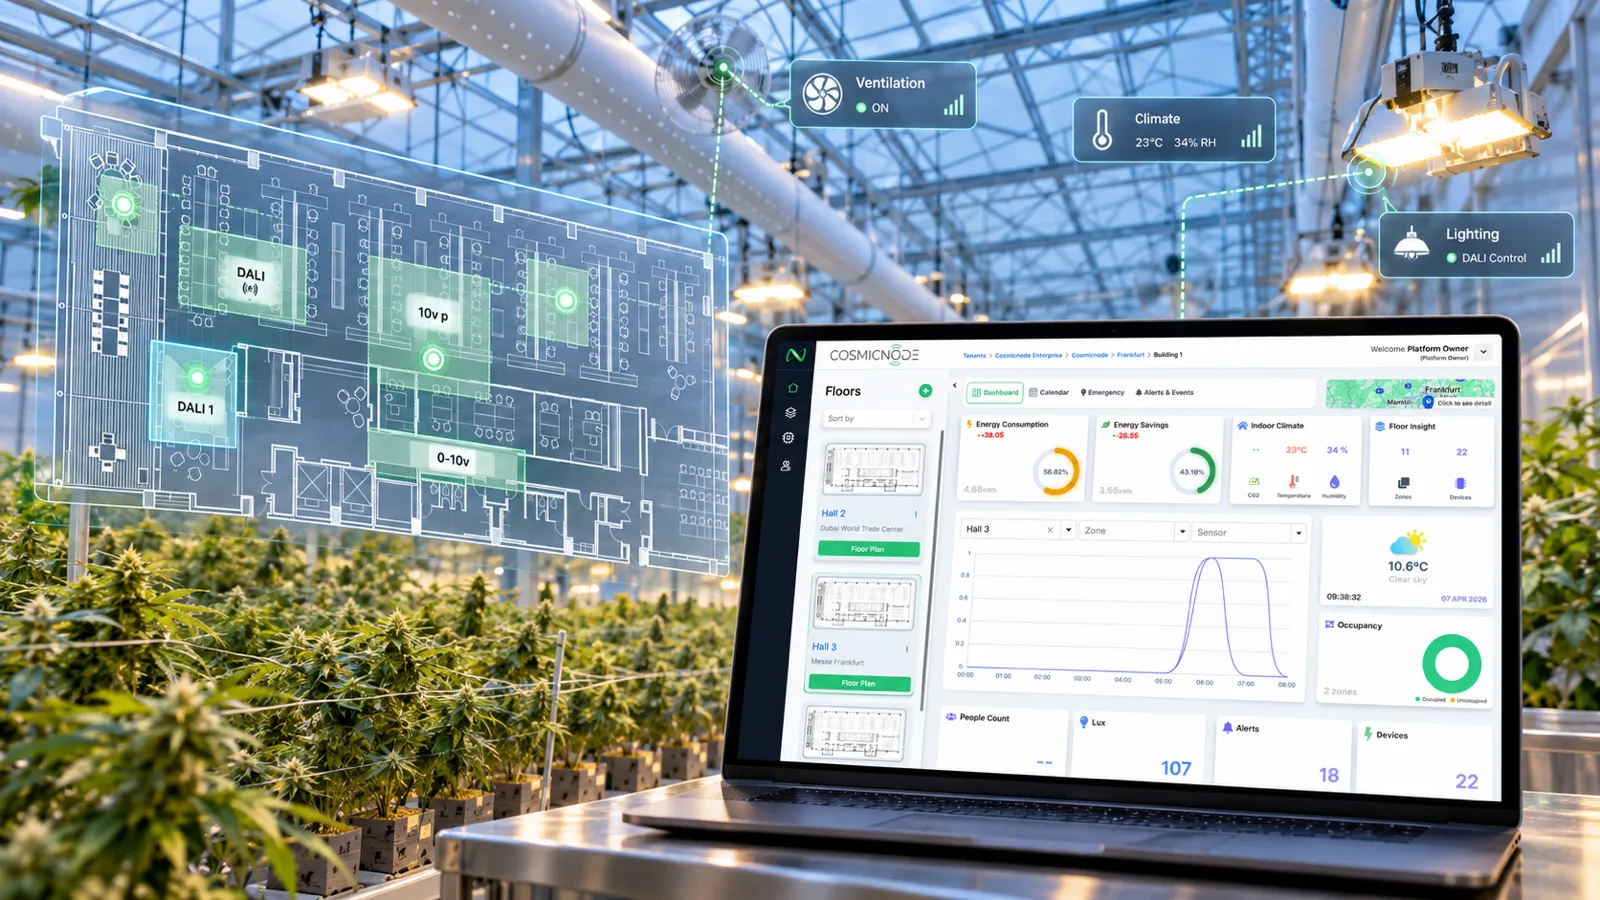
The software platform behind connected smart lighting
How Toobler built Infinity — the multi-tenant, multi-site cloud platform behind CosmicNode's connected lighting: real-time control and monitoring of thousands of LED fixtures and sensors across greenhouses and smart buildings, on a cloud-native (Amazon EKS) architecture.
 Case study IoT · Sensor-to-Cloud
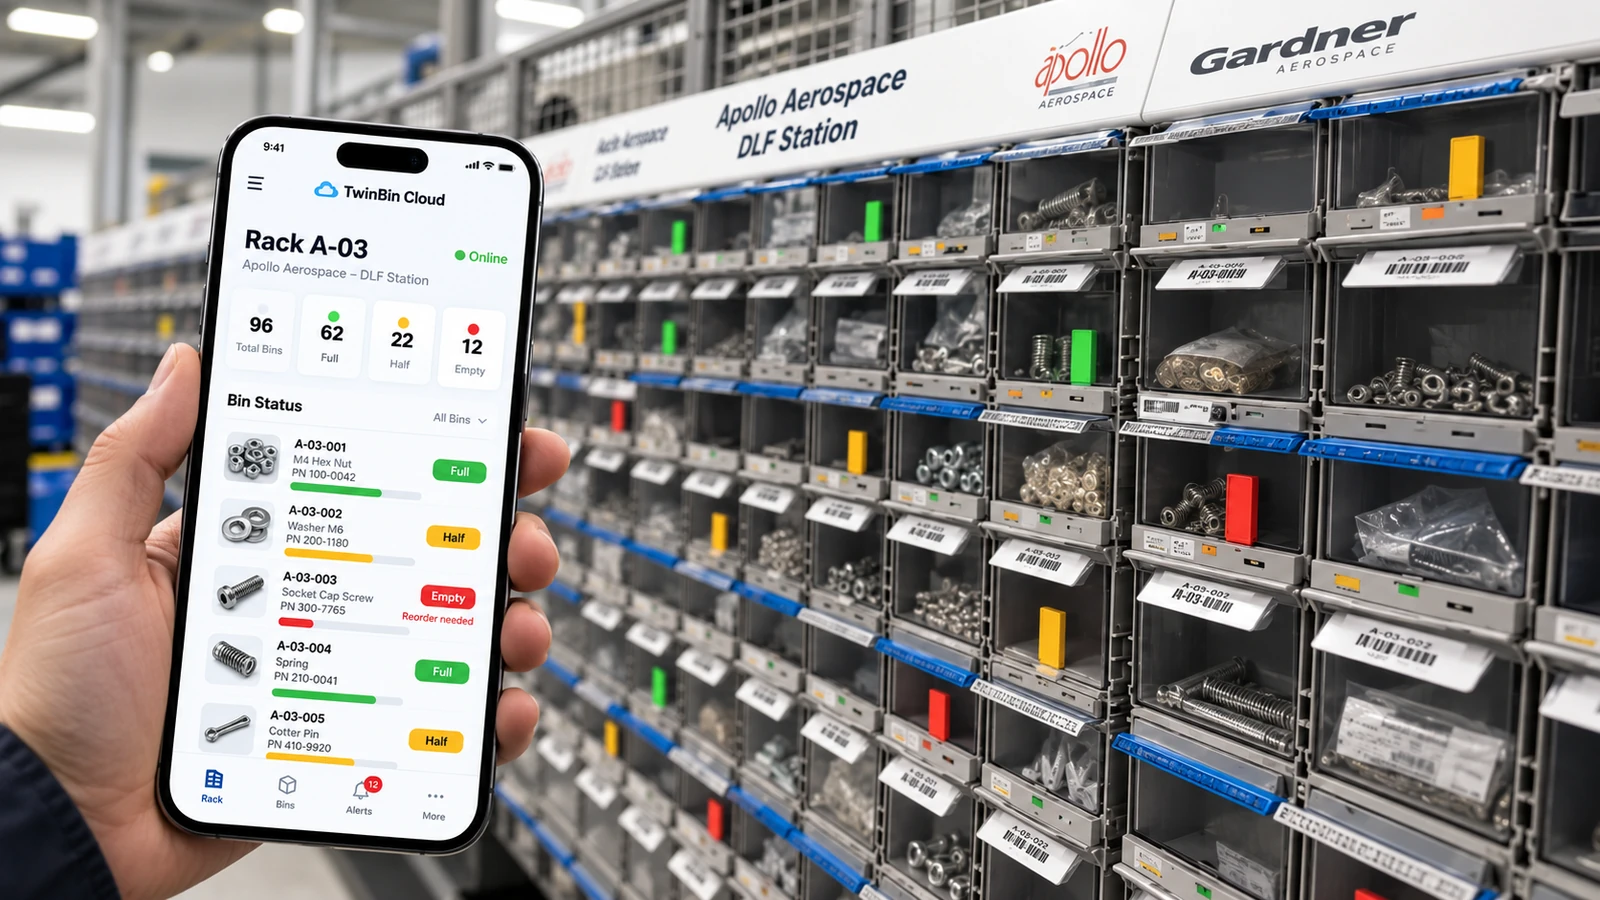
Inventory monitoring, engineered from the sensor up
How Toobler built TwinBin Cloud for Hurst Green Plastics — a connected bin-inventory system with a custom IoT sensor device, a wireless mesh of nodes and gateways, a cloud platform, and web and mobile apps.
 Case study Construction · Digital Twin · IoT
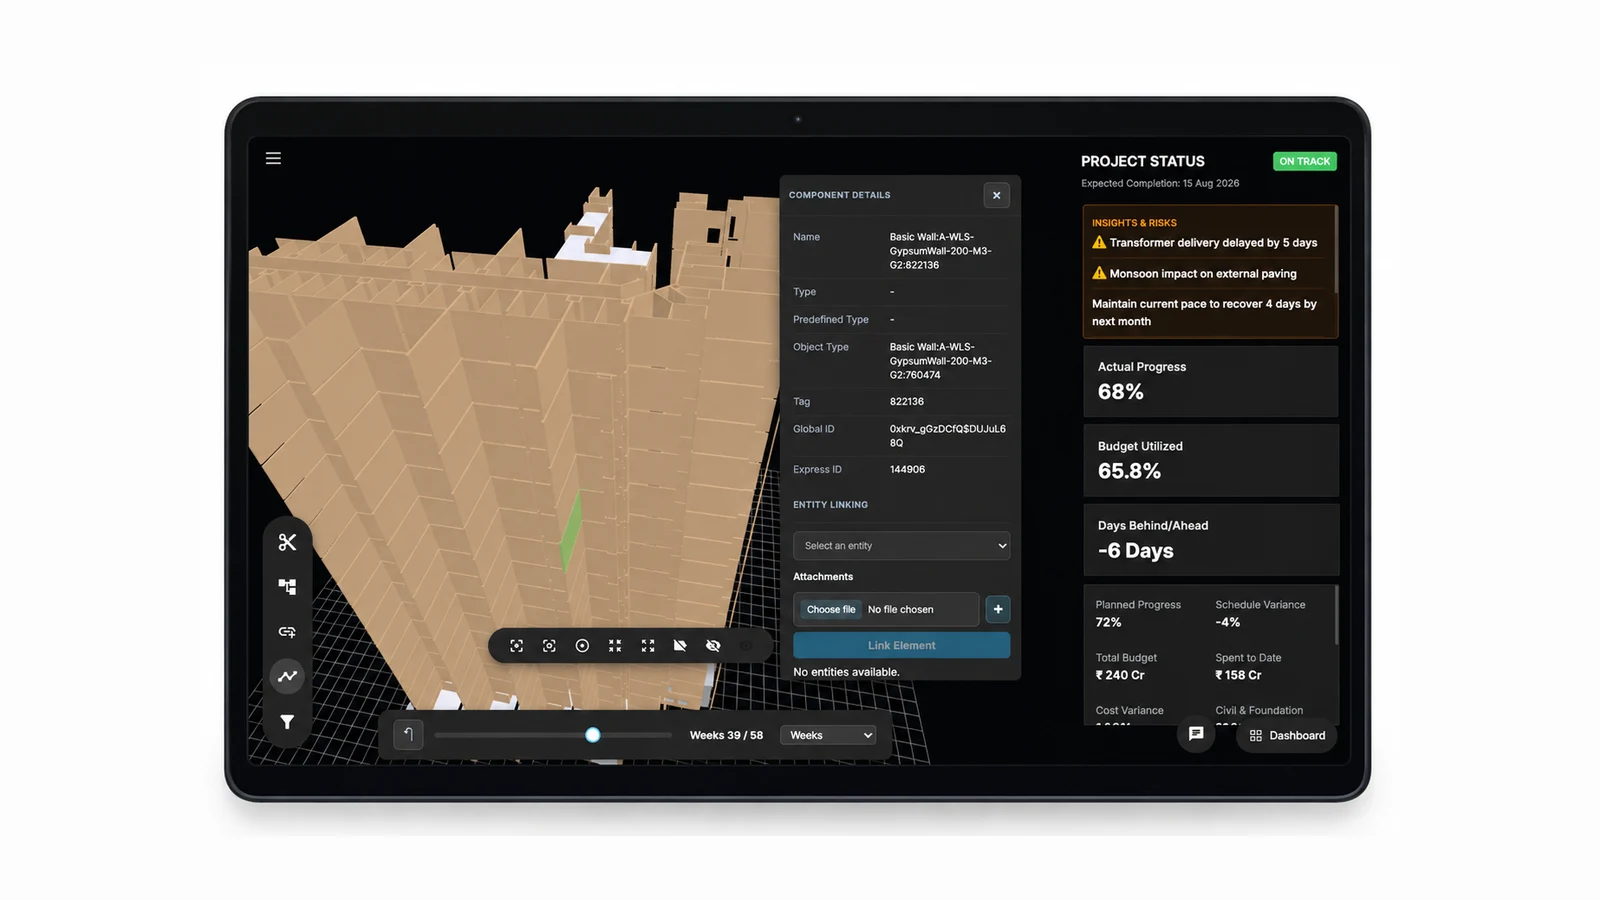
A Construction Progress Digital Twin, Integrated with BIM
How Toobler engineered a BIM-integrated construction progress digital twin for Nael — simulation, live monitoring and AI forecasting of cost, timeline and resources.
 Case study Aviation · IoT · Data Platform
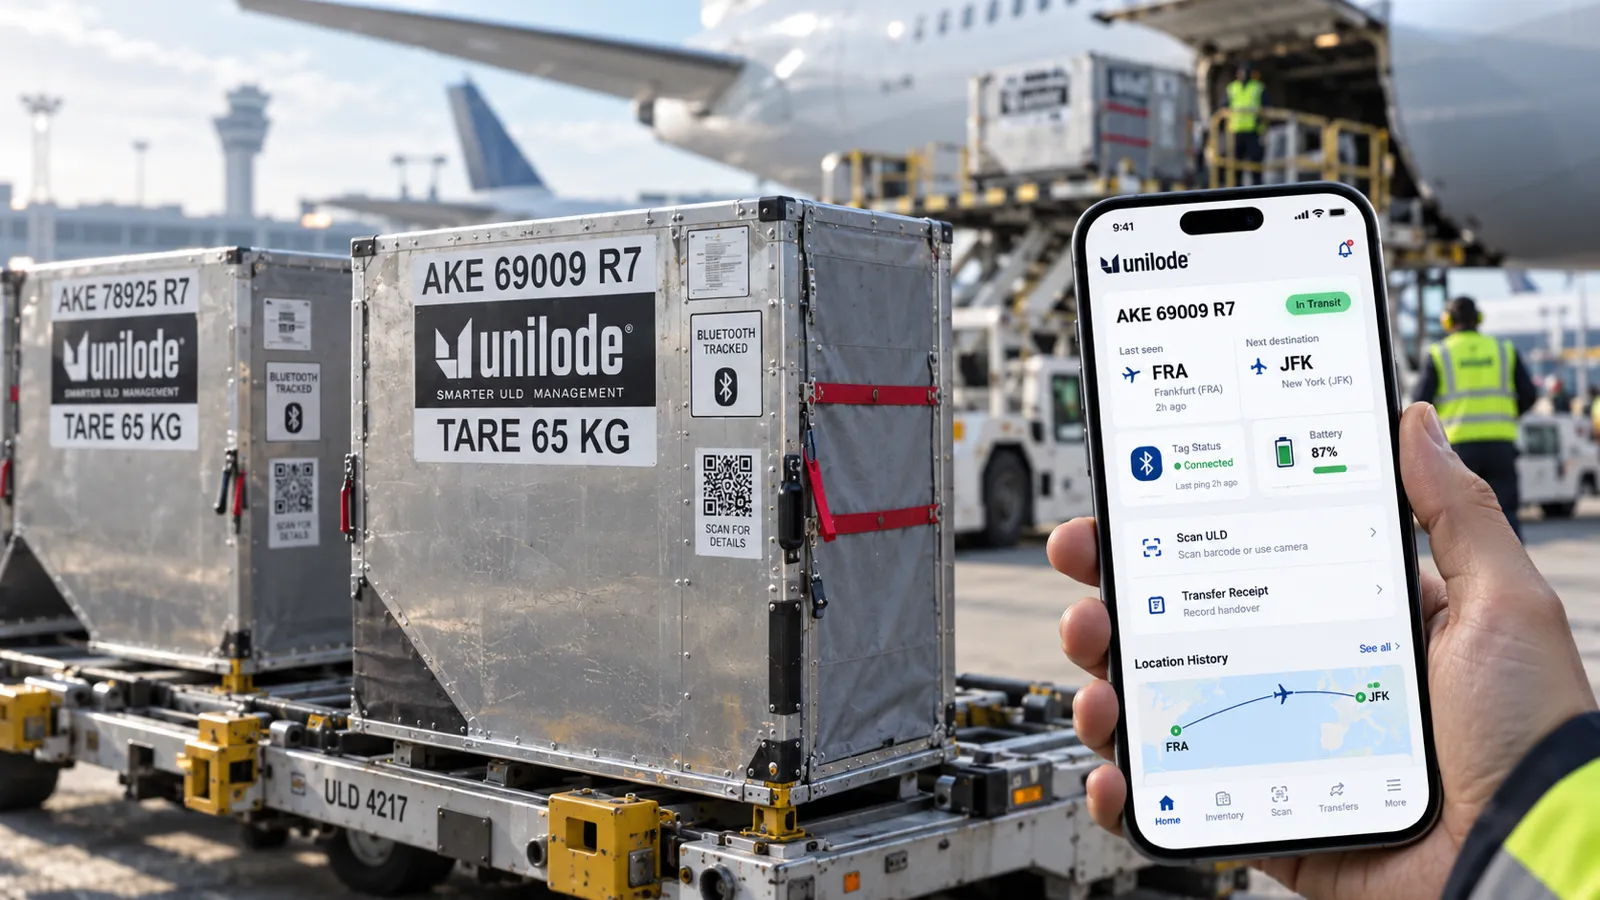
Taking ownership of a live aviation platform
How Toobler took ownership of Unilode's customer-facing platform — an enterprise data warehouse, React portals, a C#/.NET API and a React Native ULD-tracking app — through a live vendor transition.
Can’t see what’s happening in your operation?
We’ll scope the data, the assets and the picture you need.